General information about iCLOTS
General information
iCLOTS can accomdate data obtained using a wide variety of experimental set ups and devices, including:
Standard microscopy slide or dish assays
Custom-made microfluidics
Commercially available microfluidics
Traditional flow chamber devices
Image processing capabilities are separated into four main categories, with sub-applications for each:
Adhesion applications, useful for single-cell resolution measures of biological functionality.
Single cell tracking applications, useful for single-cell velocity measurements, typically as they flow through a microfluidic device. Video frames may contain multiple cells at once.
Velocity profile applications, useful for investigating rheological properties of suspensions under flow. Minimum, mean, and maximum velocity values for each video frame are also provided, suitable for monitoring changes in cell suspension speed.
Multiscale microfluidic accumulation applications, useful for insight into pathologic processes such as occlusion and obstruction in thrombosis.
Output files
Each application produces detailed output files specific to the application used.
iCLOTS detects “events” in the imaging data provided by the user. Events typically represent individual cells or patterns of cells. Each event is labeled with a number/index on the original imaging files and the imaging files as processed by the image processing algorithms applied.
Numerical output metrics are calculated for each event and are returned within an Excel sheet. For example, each cell “event” may be described by metrics like cell area or total fluorescence intensity of the cell.
Metrics are given for every feature or cell (single-cell resolution) and can be traced back to the original image using the labeled index.
iCLOTS may produce a large amount of data. In an effort to help researchers quickly make sense of their imaging dataset, iCLOTS automatically graphs results from the image processing analysis in common formats such as histograms or scatter plots.
Output files include:
Tabular data as an Excel file. In applications where several files are analyzed, individual sheets are named after individual files. These file names may be cropped to about 15 characters to prevent corrupting the output file. Please make sure individual image or video files within a folder are named sufficiently differently.
Tabular data includes:
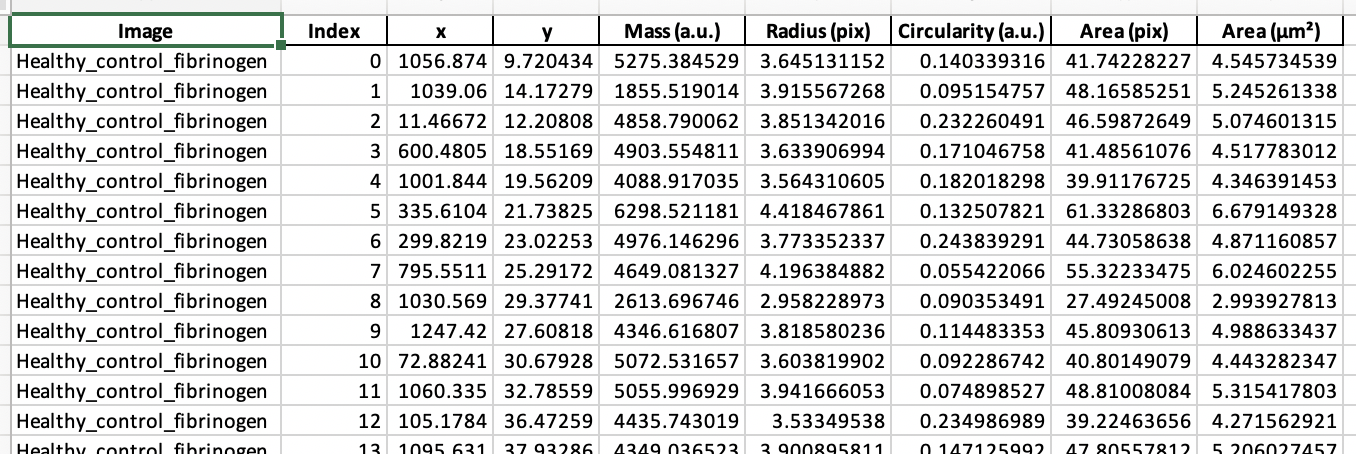
Raw data for individual cells

Descriptive statistics for all images or samples within dataset

Parameters used for later reference
Graphical results as .png images:
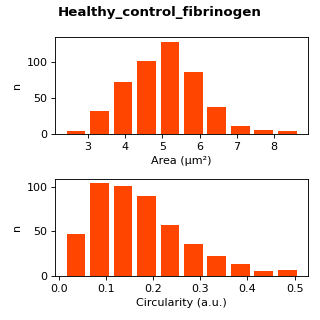
Metrics plotted for easy, quick interpretation

Pairplots for quick interpretation of relationships between variables
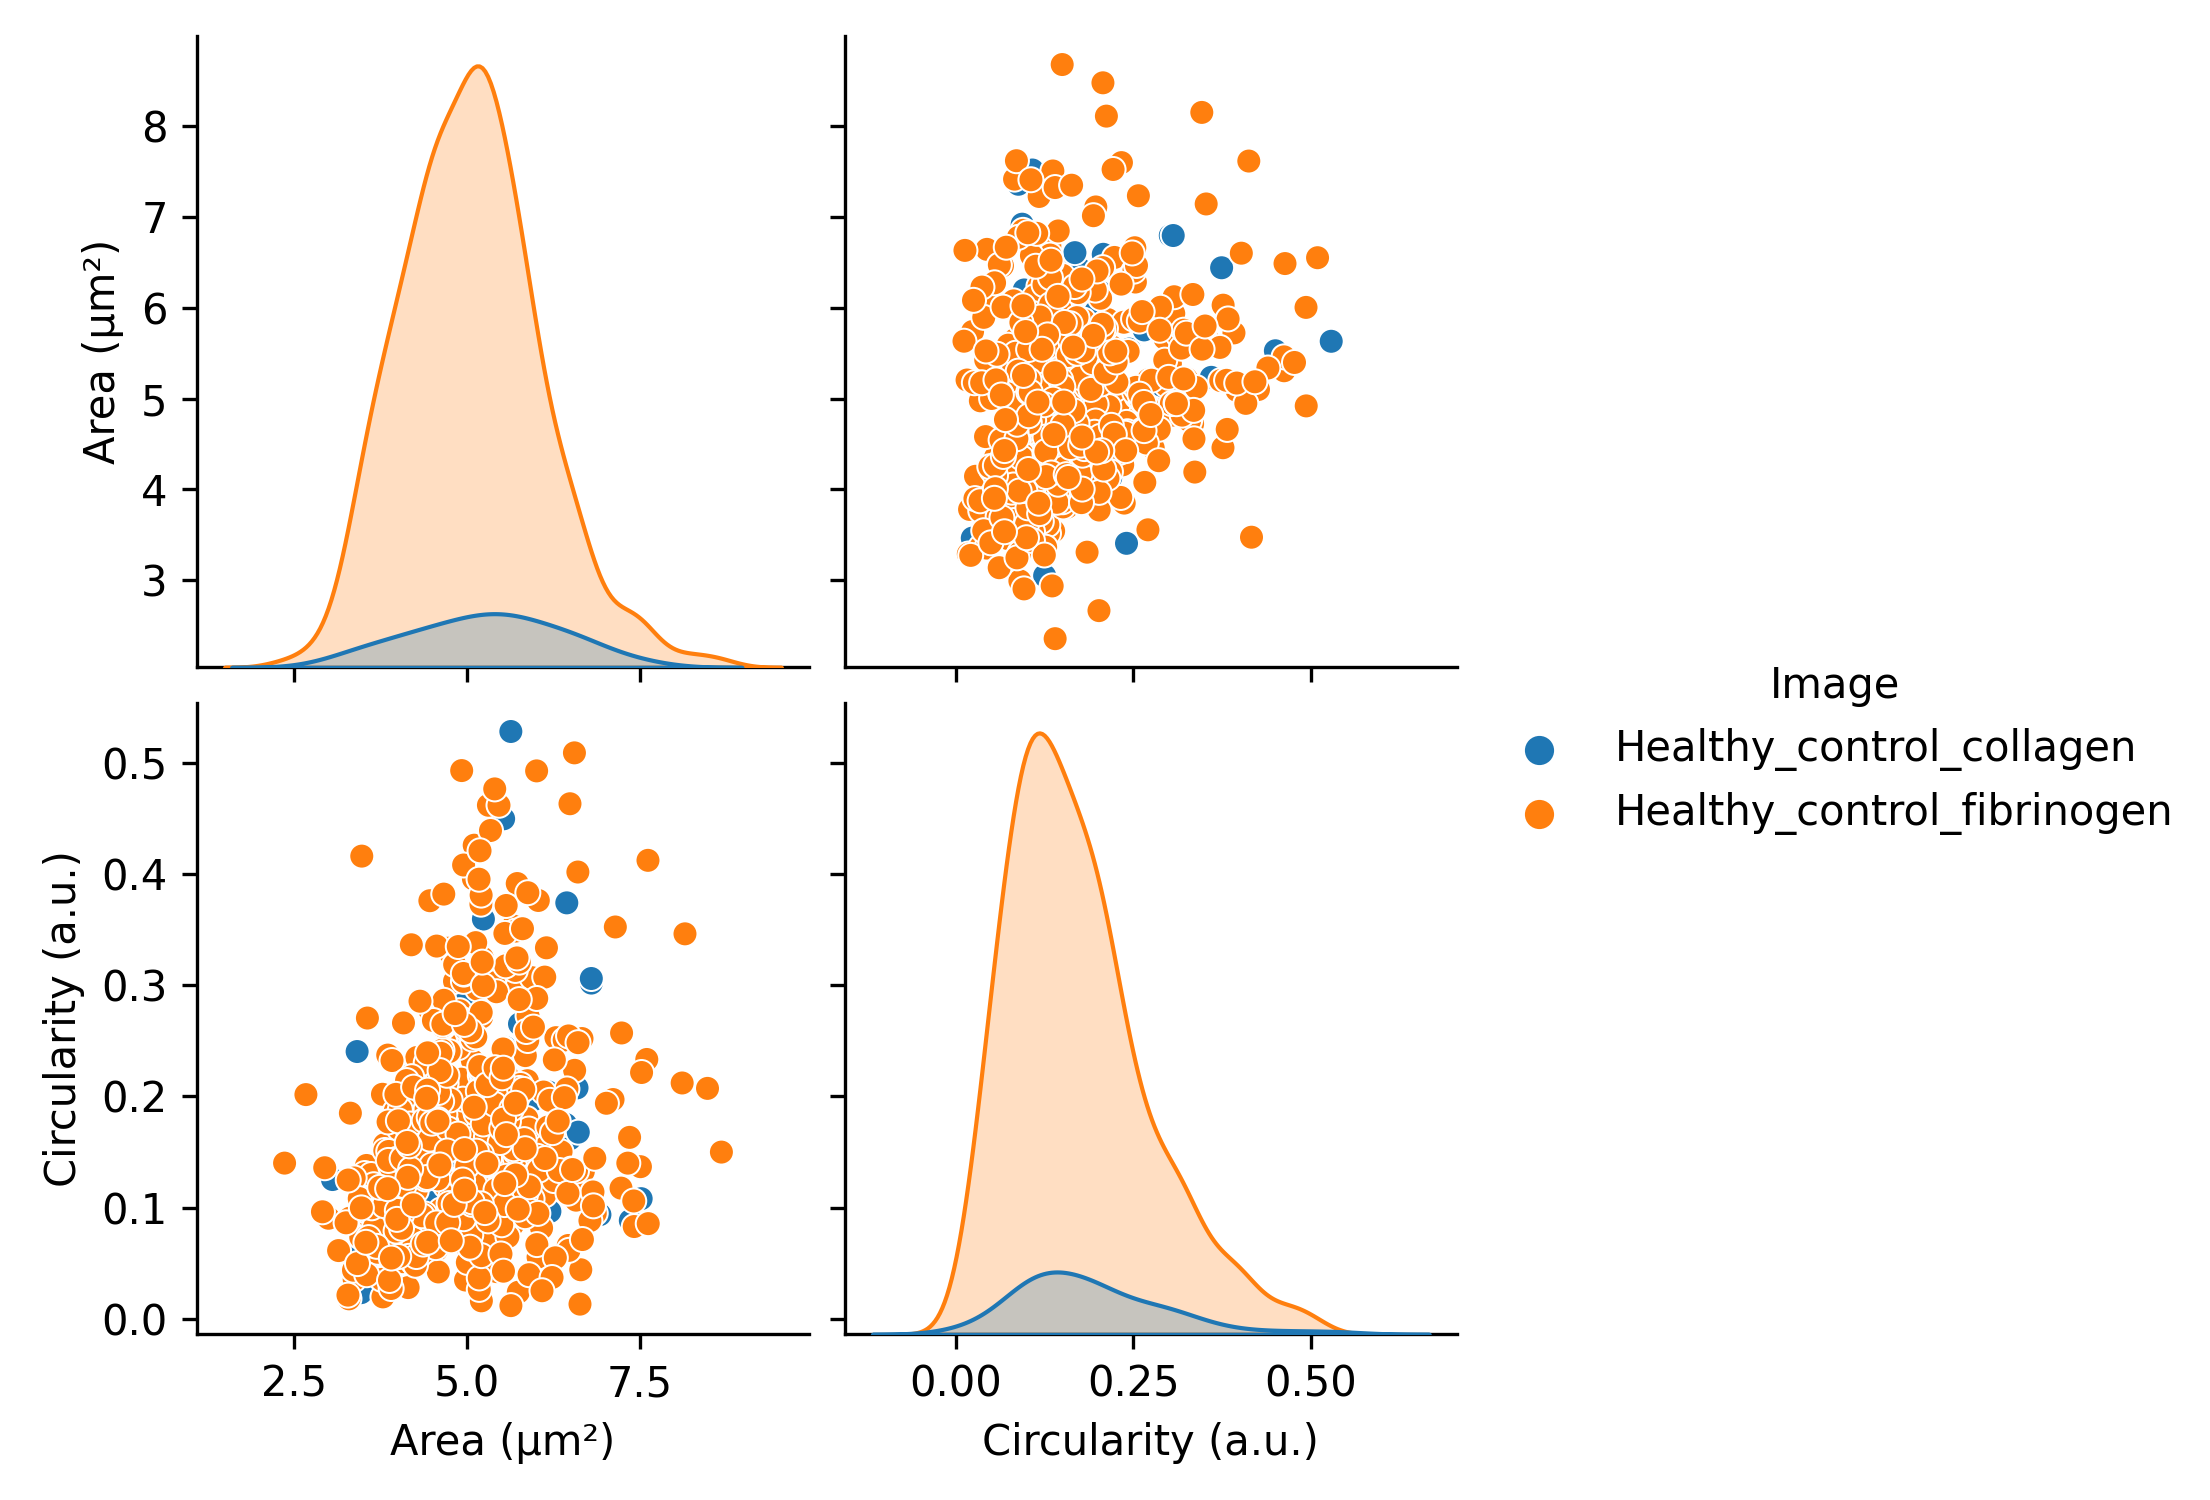
Pairplots for quick interpretation of relationships between images or conditions
The initial imaging dataset as transformed by the image processing algorithms and/or labeled with indices. Videos are returned as individual, sequentially numbered frames:
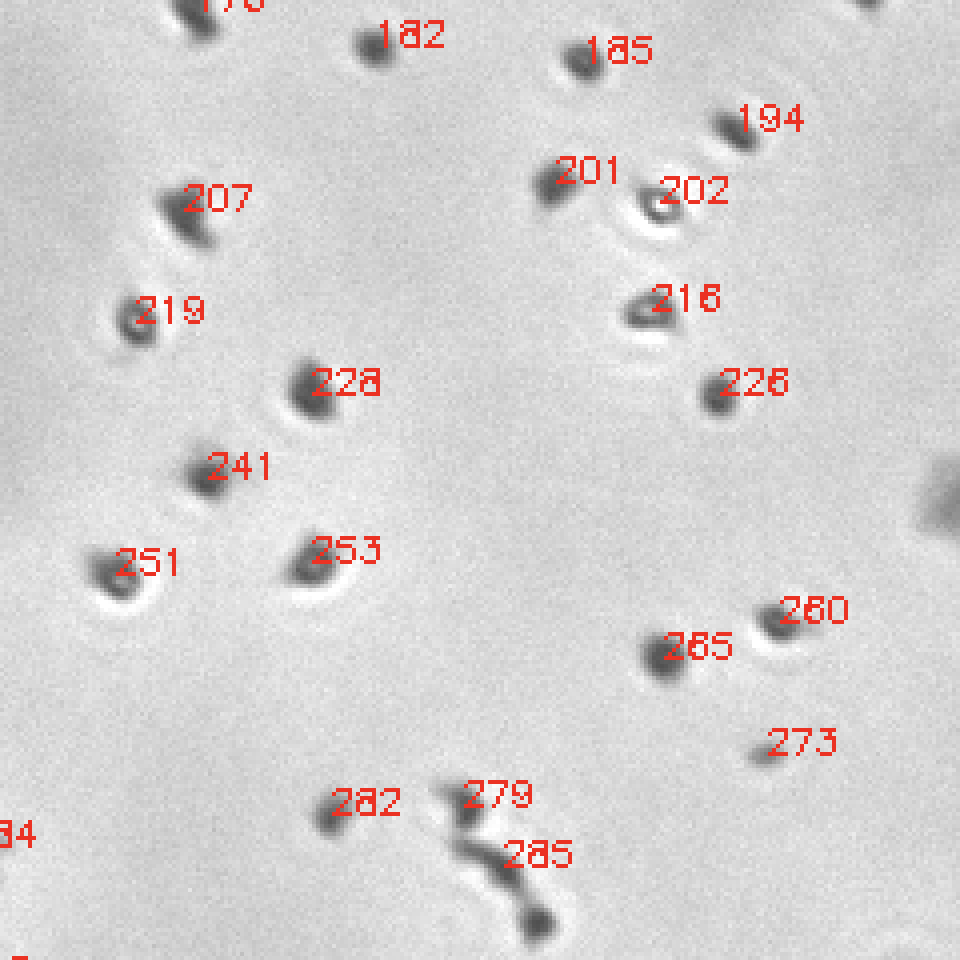
Images are labeled with indices corresponding to the Excel sheet
Interactive design
All iCLOTS applications follow a common, easy-to-use interactive format.
Users follow a series of software menus to open a specific analysis window.
All analysis windows are designed with the inputs on the left, the image processing steps as applied in the center, and the outputs on the right.
The user uploads one or several microscopy images, time course microscopy series, or videomicroscopy files as inputs. These files automatically display on the screen and can be scrolled through using the scale beneath the files.
Users may click on the scale or can use <Left> and <Right> keyboard keys to scroll through images or video frames.
Users are guided through a series of steps to describe their data.
This could including choosing a region of interest (ROI) or indicating immunofluorescence staining color channels present.
Users must then adjust parameters to fit the iCLOTS image processing algorithms to their specific set of data. Parameters are numerical factors that define how image processing algorithms should be applied. This could be a number such as minimum or maximum cell area.
Every effort has been made to ensure that parameters are intuitive. If the role of a parameter is unclear, please access the on-screen help documentation using the “Tutorial” button in the lower left-hand corner. Note that in iCLOTS, “a.u.” represents arbitrary units, typically used to describe pixel intensity values.
Effects of changing parameters are shown in real time.
iCLOTS currently does not have a zoom function, but this is planned for a later release. In the meantime, if your data is relatively low-magnification, we suggest cropping a small region of interest using the video processing tools and testing parameters on that image, then applying the same parameters to the larger image.
The “Run analysis” button on the top right of the analysis screen initiates the finalized analysis using the parameters provided.
Typically an analysis takes seconds-to-minutes - this depends heavily on file size and number.
If analysis, particularly of video files, is taking more than 3-5 minutes, consider reducing the resolution or length of files using the video editing suite.
Graphical results are automatically displayed when the analysis is complete.
Experimental considerations
Users should consider practical experimental design concerns before use.
Choosing cell concentration:
For all experiments involving quantification of single cell events, in our experimental and software testing we chose cell concentrations or hematocrits to ensure that we could operate within a quantifiable dynamic range of the microfluidic devices for both healthy or untreated controls and experimental samples. iCLOTS in its current iteration cannot distinguish between overlapping cell events. When you’re choosing parameters, each cell should be represented by one dot. Typically we perform an initial experiment with a range of cell concentrations such that the most adhesive samples can adhere without overlap, then use this concentration for all future experiments.
Choosing brightfield illumination vs. fluorescence microscopy:
Brightfield microscopy does not rely on any type of cell labeling. We’re found some stains can affect cell membrane properties, i.e. R18 appears to damage the RBC membrane. In experiments where simple count or simple movement is quantified, brightfield microscopy is typically sufficient.
Blood cells naturally have a heterogenous membrane appearance, which can affect area or other morphology measurements. To obtain the highest signal-to-noise ratio (e.g. the most apparent difference between image background and cell signal) we recommend staining cells or cell solutions with a stain indicating the cell membrane and using fluorescence microscopy. The fluorescence microscopy adhesion assay quantifies a secondary stain indicating some biological activity. Future version of iCLOTS will incorporate secondary “functional” quantification in additional applications.
Choosing constant perfusion vs. pressure-driven flow in microfluidic experiments:
iCLOTS has been shown to produce accurate, reliable analyses of both constant perfusion (syringe pump) and pressure-driven flow across a range of microfluidic, flow-based experiments. While pressure-driven flow is more physiologically relevant, users may find they are limited by equipment availability or small sample sizes, or experimental set up may necessitate the greater simplicity or ease-of-use of constant perfusion systems. Users should carefully consider the importance of physiological relevance in their assays. If constant perfusion is used, consider designing microfluidic devices with large bypass channels to prevent significant changes in pressure from channel clogging.
Over the course of long microfluidic experiments, factors such as a build up of adhesive factors on channel walls, cell suspension settling, or other variables may lead to artifacts within data. The iCLOTS team suggests plotting quantitative metrics with frame number as the x-variable to ensure results are reasonably consistent over time.